


 Official publication of the Czech Society of Ultrasound in Obstetrics and Gynecology.


Objective: To evaluate circulation of the lower uterine segment (LUS) using three-dimensional power Doppler ultrasound (3DPD) in patients after Cesarean section (CS) and uncomplicated vaginal delivery (VD).
Study design: We evaluated 60 patients after CS and 60 patients after uncomplicated VD by ultrasound admitted at the Department of Gynecology and Obstetrics, Jessenius Faculty of Medicine in Martin, Comenius University in Bratislava and University Hospital Martin, Slovakia, from November 2021 to February 2023. A spherical volume of 15 cc was captured for each patient with a 3D transabdominal probe. We used an ultrasound software program Virtual Organ Computer-aided Analysis (VOCAL) to calculate three vascular indices – vascularization index (VI), flow index (FI), and vascularization-flow index (VFI). We also assessed Doppler indices in the uterine arteries (UtA). The measurements were taken 48 hours postpartum.
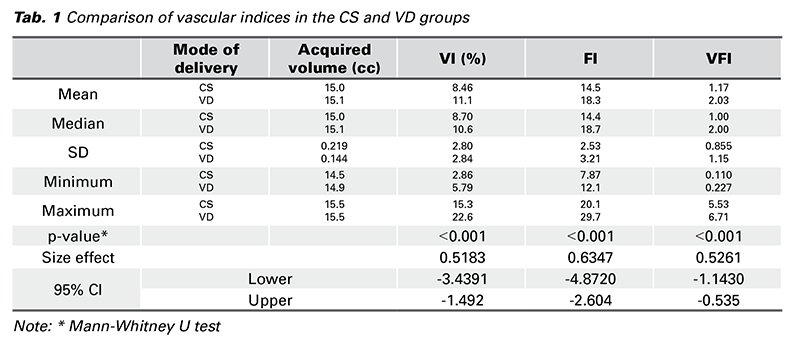
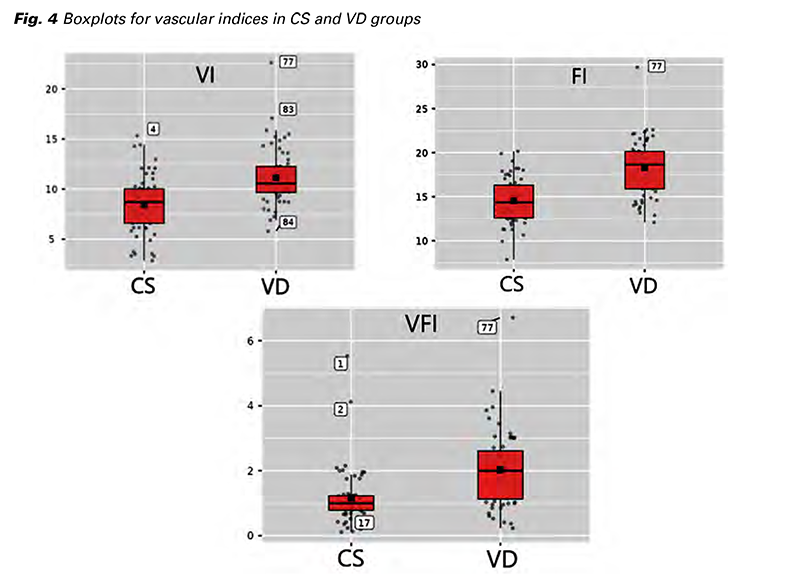
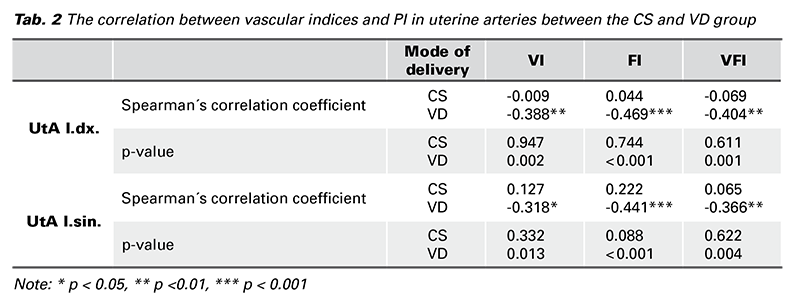
Results: There was a significant difference in all three vascular indices between the studied and controlled group with a p-value ˂ 0.001. We observed a significant inverse correlation between vascular indices and pulsatility index (PI) in UtA in the VD group, but we found no such correlation in the CS group.
Conclusion: Although it is still not well understood, 3DPD can be a suitable ultrasound method to study postpartum uterine circulation. Our results proved significant differences in vascularization and perfusion in LUS in patients after CS vs. VD. Therefore, 3DPD may be useful in the ultrasound assessment of healing areas after CS. To the best of our knowledge, this is the first study analyzing vascular indices in LUS during puerperium in patients both after VD and CS.
During the puerperium, the maternal organism relatively returns to its pre-pregnancy state, including anatomical and morphological changes in the uterus. In contrast to the pregnancy-related changes, there is still a lack of literature studying the postpartum changes in uterine circulation (1,2). Most studies reported early changes in uterine artery (UtA) Doppler indices (3). However, none of them used three-dimensional power Doppler ultrasound (3DPD), which disposes of objective assessment of vascularization in a whole organ (4). 3DPD allows visualization of small vessels with a relatively lowvelocity blood flow compared to color Doppler, and it also detects blood flow in vessels smaller than 1 millimeter in diameter. The power Doppler signal can be quantified based on its intensity and relative proportion of 3D pixels in an acquired volume. For such quantification, specific ultrasound software programs are used. One of them is VOCAL (Virtual Organ Computer-aided AnaLysis) which generates three vascular indices – vascularization index (VI), flow index (FI), and a combination of both - vascularization-flow index (VFI) (5). Originally, the three vascular indices were described by Pairleitner et al. in 1999 (6).
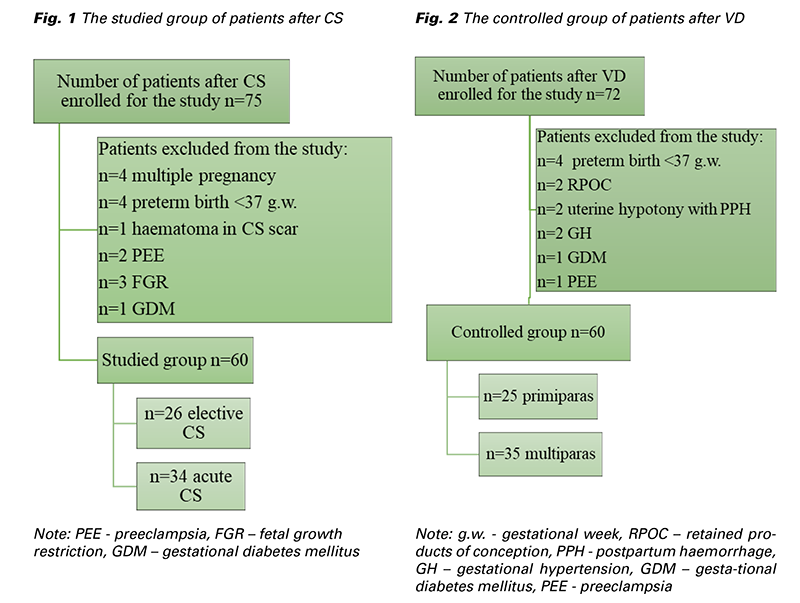
From November 2021 to February 2023 a total of 147 patients admitted at the Department of Gynecology and Obstetrics, Jessenius Faculty of Medicine in Martin, Comenius University in Bratislava and University Hospital Martin, Slovakia, were enrolled for the study. The study group was created by 75 patients after CS and the control group after uncomplicated VD by 72 patients. Only singleton fullterm (37+0 to 41+6 gestational week) pregnancies were included. A total of 120 patients underwent the ultrasonographic examination (Fig. 1 and Fig. 2). The elective CS subgroup involved patients admitted for elective CS with no contractions and < 5 cm cervical dilation. On the contrary, the acute CS subgroup was formed by patients, on whom the CS was performed during an active phase of labor with regular contractions and cervical dilation > 5 cm. 26 patients out of a total number of 60 underwent elective CS. Two patients had a history of one previous CS. Five patients had a history of two previous CSs, resp. the remaining 19 patients were primiparous women with no history of CS. In the acute subgroup, from a total number of 34, 13 patients had a history of one previous CS, the remaing 21 patients were again primiparous women with no history of CS. None of the patients had a different uterine surgery from CS (e.g. myomectomy). The indication for CS was not crucial and it varied among patients. The CSs were performed by different surgeons. They all performed one-layer uterine incision closure with continuous absorbable polyglycolide-co-L-lactide stitch. The level of the incision in LUS depended on the phase of the labor. According to our institutional protocol, every patient received 10 international units (IU) of oxytocin IV after delivery as a prevention of postpartum hemorrhage.
One ultrasound examination of vascular indices and Doppler flowmetry in both UtAs was carried out. Every measurement was taken by a single examiner (T.P.) under the supervision of an experienced sonographer (K.B.) 48 hours postpartum. All examinations were performed using VOLUSON™ E 10 (GE Healthcare) with a transabdominal (TAS) transducer. All 3DPD data were acquired with preinstalled identical settings: 3D TAS transducer; frequency 3-9 MHz; pulse repetition frequency 0.6 kHz; wall motion filter low 1; quality normal; gain -5.6. The gain was the only setting that was individually minimally changed if needed. A longitudinal view of the uterus was obtained and then the power Doppler mode was switched on. The 3D box was placed on the region of interest (ROI), which was the LUS, without the endometrium. A spherical tissue volume of 15 cc +/- 0.5 cc was automatically acquired with ultrasound POLE 1 and POLE 2 functions with 30° rotational steps (Fig. 3). The data were stored on the hard disk for further evaluation. The histogram function of VOCAL automatically calculated three vascular indices – VI, FI a VFI. VI is the ratio of color voxels to all voxels in the ROI expressed as a percentage, and it reflects the density of vessels. FI is the average color value of all color voxels, indicating the average flow velocity. VFI is the sum of weighted color Doppler voxels divided by all voxels in the region of interest. It reflects both the density of vessels and the number of blood corpuscles flowing in the vessels of the volume (6). To minimize the flash artifact the patients were asked to remain still during the examination with their breath held for the time needed for the volume acquisition.
For obtaining the Doppler indices in the uterine arteries a two-dimensional (2D) TAS transducer was used. To optimize the image, certain adjustments in pulse repetition frequency, wall motion filter, gain, and sample gate were made, followed by international guidelines for measurement of the flowmetry in UtA. UtA was identified by placing the 2D TAS probe at the level of the isthmus, by angling it medially. A 2mm sample above the ascending branches was used, with the insonation angle kept close to 0°.
We focused mainly on the pulsatility index (PI) in both the UtAs. The data were transferred to a worksheet and then analyzed. The quantitative variables were presented as means, median, standard deviations (SD), standard errors (SE), maximums, and minimums. For comparison of the variables in both studied groups, we used a non-parametric Mann- Whitney U test. A p-value of < 0.05 was considered statistically significant. For statistical correlation between given variables, we used Spearman´s correlation coefficient.
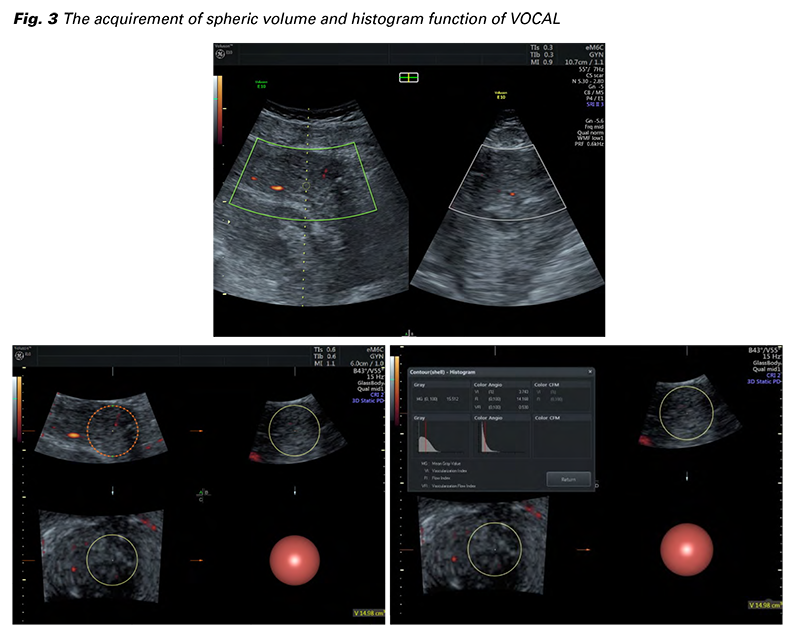
A total of 147 patients agreed to participate in the study, and 27 of them were excluded. Of those, 60 had a CS delivery and 60 uncomplicated vaginal delivery. The age of patients after CS ranged from 22 to 37 years (an average of 28 years), in the VD group the age ranged from 22 to 39 years (an average of 30 years). The average BMI in the CS group was 30.5 kg/m2 and in the VD group 30.1 kg/m2. We Fig. 3 The acquirement of spheric volume and histogram function of VOCAL observed a significant difference in all three vascular indices between the groups (Tab. 1). The mean VI in the CS group was 8.46% in comparison with the VD group, where the mean VI was 11.1%. A similar trend was observed in FI and VFI. The mean FI in the CS group was 14.5 and in the VD group 18.3. Patients after CS showed lower mean VFI comparing the VD group (1.17 vs. 2.03), respectively (Fig. 4).
Using the non-parametric Mann-Whitney U test, we observed no significant differences in PI in both the UtAs in CS vs. VD group with p > 0.05. Surprisingly, we observed a significant inverse correlation between vascular indices and PI values in both the UtAs in the VD group. We found no such correlation in the CS group (Fig. 5, Tab. 2). For the determination of this statistical dependence, Spearman´s correlation coefficient was used.
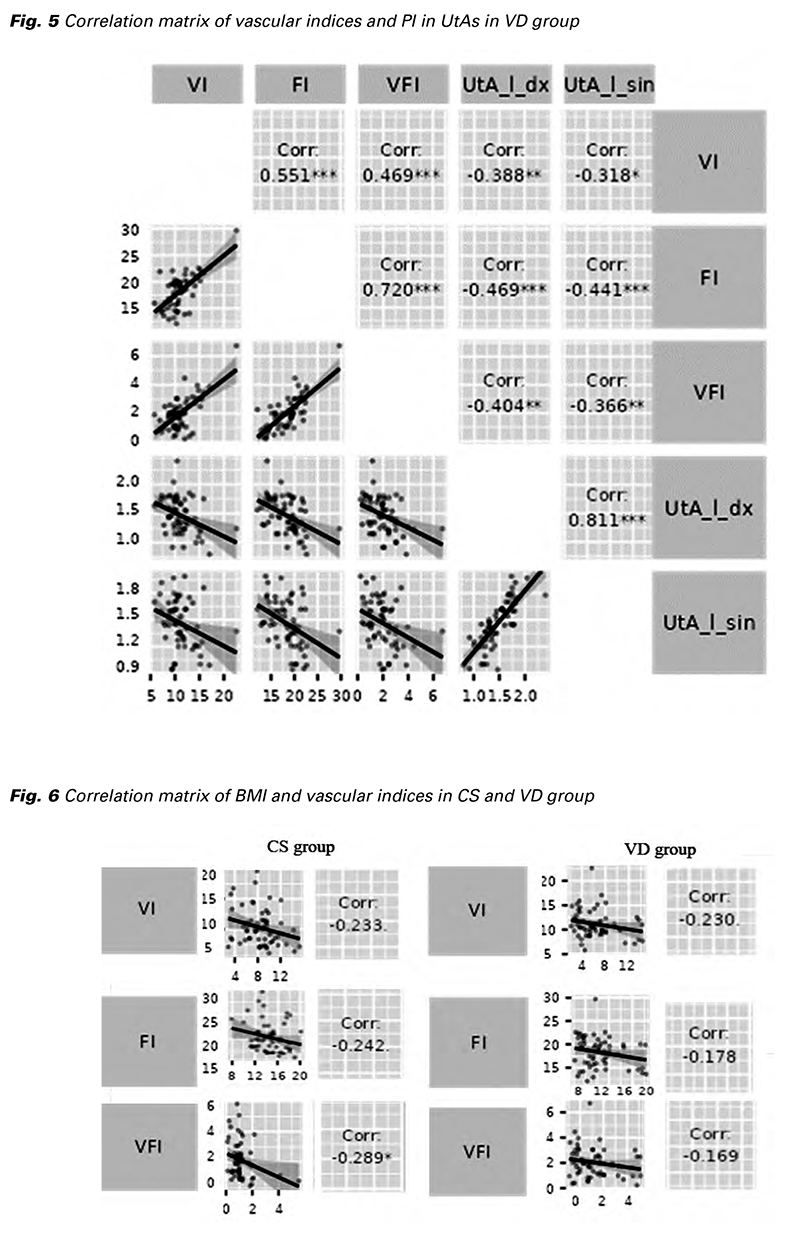
As the vascular indices are sensitive to the distance between the ROI and the transducer, we even analyzed a possible effect of body mass index (BMI) on the final results. We observed a negative correlation between all three vascular indices and BMI in the studied and control group, but only in one case, the negative correlation was significant. A statistically significant negative correlation was found between VFI and BMI in the CS group (p = 0.025) (Fig. 6).
We even found a possible difference in vascular indices between the patients after elective and acute CS. As a second objective, we chose to compare primiparas and multiparas in the VD group. In such cases, we found no significant differences (p > 0.05).
Depiction of the morphology and circulatory conditions in the postpartum uterus using 3DPD could be regarded as a suitable ultrasound modality. This study demonstrated significant differences in vascular indices obtained from LUS between the patients after CS and “the non-operated” LUS in patients after uncomplicated VD 48 hours postpartum. As 3DPD has better sensitivity for smaller vessels in diameter and lower velocities, we assume, it could be a promising modality to evaluate the perfusion in LUS. As mentioned above, VOCAL calculates three vascular indices – VI, FI, and VFI. To the best of our knowledge, there is no study reporting vascular indices in the postpartum period, so when deciding about the methodology and evaluation of the results, we relied on so far published papers from different areas of gynecology and obstetrics (4-10). VI is considered a well-reproducible index. It can differentiate vascularization with a good correlation to histopathological findings. Nieuwenhuis et al. analyzed the reproducibility of vascular indices in uterine fibroids. The VI was the most reliable vascular index with a 95% confidence interval in intraclass correlation coefficient (ICC) of 0.89 (11). Minsart et al. even correlated preoperative values of vascular indices with histopathology of uterine fibroids after myomectomy or hysterectomy. High cellularity, fibrosclerosis, and positivity of Ki-67 strongly correlated with higher VI and VFI. The vascular density was likewise positively correlated with VI. In contrast, there was a significant negative correlation between VI and VFI with ischemic necrosis (12). Belitsos et al. analyzed the vascular indices in cervical dysplasia and malignancy. All the vascular indices were increased in cases of malignancy. In the IIIB-IV stages, the most increased vascular index was VI, which reflected a higher vessel density, but without a significant increment of flow intensity, probably due to vessel compression by the tumor (7). The VI showed off as the most reliable vascular index in the morbidly adherent placenta as a reflection of increased vessel density (10). Significant differences in all vascular indices were observed in several studies analyzing placental perfusion in pregnancies with fetal growth restriction and preeclampsia (11,13,14).
As mentioned above, all three vascular indices were significantly lower in the CS group. We refer to such findings as interruption of continuity of the myometrium in the LUS and vessels within it. The presence of a hysterotomy suture, strangulation of the tissue around it, and local hypoxia or ischemia could be possible causes of such findings. Chang et al. compared the blood flow in the operated and unoperated areas of the uterus in patients 7 days and 3 months after laparoscopic myomectomy. Using 3DPD, they observed more pronounced tissue perfusion from the operated area towards the more peripheral, non-operated parts of the uterus. Such blood flow was reflected in the reduced PI and RI in UtA. Three months after the operation, blood flow in the uterus was significantly reduced. 3DPD is also suitable for imaging avascular hematomas, which negatively affect healing (15). In our case, 48 hours postoperatively, the scar volume is still quite large, decreases mildly after the surgery, and is likely to be edematous, containing blood clots. Chang, W.C. et al. focused on the effect of UtA ligation on vascular indices in myometrium and PI values in UtA after laparoscopic myomectomy. They noted a significant transient “downstream” decrease in PI and RI in the UtA in patients after UtA ligation compared to patients who underwent myomectomy without ligation. The 3DPD was performed 7 days after the operation. Three months after the myomectomy, PI and RI values in UtA were the same as before surgery. However, UtA ligation did not cause a decrease in myometrial perfusion, as reflected by the measured values of VI, FI, and VFI by 3DPD (16). El Behery et al. performed a 3DPD examination in patients after laparotomic myomectomy a month after the operation and then with a 3-month interval. They observed the effect of a semi-permanent cervical tourniquet (i.e. placing a polyglactin suture on the cervix in the area of the internal portal) on perfusion in the myometrium. At 1 and 3 months after surgery, they observed a progressive reduction in VI and VFI, while FI remained almost unchanged. However, the differences between the monitored and control groups were not significant (17). Stępniak and Czuczwar observed the effect of UtA embolization on the value of vascular indices in patients with leiomyoma. These values were compared to patients administered ulipristal acetate as part of the therapy. In both groups, there was a decrease in VI, FI, and VFI 3 months after treatment, but only in the case of VI and VFI to a significant extent (18). Based on the available literature, we would assume that the values of the vascular indices would be lower in the early puerperium in patients after CS, as a result of the hysterotomy or “disruption” of the integrity of the myometrium and endometrium tissue in the LUS. Our results confirmed this hypothesis, as the differences in vascular indices in the “operated” and “nonoperated” uterus were significant. Values of vascular indices that reflect the degree of vascularization and perfusion could reflect the current phase and quality of hysterotomy wound healing. In practice, with the given methodology, we could postoperatively monitor patients after surgical interventions at certain time intervals. The values of vascular indices change with the degree of ischemia, necrosis, or increased vascularization and angiogenesis, respectively. All these processes are part of wound healing. Their values could be correlated with the morphology of the scar or the possible development of symptoms during secondary or incomplete healing.
During the first weeks after birth, there are significant changes in uterine circulation. The immediate cause of the changes in the circulation parameters is caused by the contraction of the myometrium. Guedes- Martins et al. analyzed the influence of several selected factors on PI and RI in the UtA at given time intervals, while an ultrasound examination was also performed on the 2nd day of the puerperium. However, at this time, they did not confirm the effect of age, BMI, mode of delivery (CS vs. VD), hemoglobin values, or breastfeeding on PI and RI in UtA. Baron et al. analyzed the influence of the mode of delivery (CS vs. VD) on the impedance in the UtA. In their study, no significant differences in PI and RI were noted between the mentioned groups, and what is more, not even between patients after elective and acute CS (19). Impedance in the UtA is probably also influenced by the process of uterine involution and the retroverted and retroflexed uterus. The contractility of the myometrium itself is influenced by several factors, such as the administration of uterotonics or breastfeeding (19,20). At our workplace, the most common uterotonics used are oxytocin and methylergometrine. However, oxytocin has a short half-time, so even if it was administered during the active management of the third stage of labor, at the time of our ultrasound examination, the PI values should not have been affected by it. Although methylergometrine has a longer half-life, it is not used routinely and the examination was not affected by this uterotonic either. Effect of the breastfeeding, which causes an endogenous release of oxytocin, remains unanswered. Few studies have included breastfeeding as a possible factor influencing PI in UtA. However, according to the available sources, a significant effect of breastfeeding has not been demonstrated (3,19,21). We, therefore, did not focus on the effect of breastfeeding in our study.
It is obvious that CS in an active or later stage of labor should be performed with appropriate consideration of the anatomical changes in the lower uterine segment, as a too-low incision is related to a higher risk of scar dehiscence or uterine rupture in a subsequent pregnancy (22). We did not observe statistically significant differences between the vascular indices in CS subgroups. A question for future research remains whether there is a correlation between vascularization and flow intensity in the LUS with residual myometrial thickness (RHM) or the formation of the niche. However, an interval of at least six months after the CS is needed for such an assessment. The hysterotomy is considered definitively healed in such time (23). Anyway, Dosedla and Calda compared the USG findings of CS scars after 6 weeks and 6 months postoperatively. Measuring the thickness of the scar itself and the myometrium proximal and distal to the scar, they proved that ultrasound examination at the end of the puerperium can serve as an early predictor of the healing quality of the hysterotomy wound and thus select women with a higher risk of postoperative complications (24).
In this study, we focused on possible differences in vascularization and blood flow in the LUS area of the uterus in patients after CS and VD. We noted significant differences in all three vascular indices. VI, FI, and VFI were significantly lower in the group of patients after CS. 3DPD and VOCAL software are not routine gynecological examinations. Although VOCAL does not represent the newest method of quantifying vascularization and blood flow, the methodology requires the availability of this software in the ultrasound device, more detailed device settings, a longer time for the examination itself, and an expert sonographer in principles of 3DPD. However, the benefit of this study for the future may be a better understanding of uterine circulation in the early puerperium, as well as the adoption of the methodology itself. Last but not least, examination of the circulation in the LUS of the uterus using 3DPD in post-CS patients in early puerperium can reflect the degree of ischemia, adequate or inadequate perfusion around the hysterotomy and thus predict a possible defect in the scar with the eventual development of symptoms. To the best of our knowledge, this is the first study analyzing vascular indices in LUS during puerperium in patients both after VD and CS.
